
While it doesn’t necessarily look like it on surface level, Nvidia (NVDA) just flashed a rare quantitative signal. In the last 10 weeks, there were only three instances of up weeks, with the rest being down weeks (defined as the negative return from Monday’s open to Friday’s close). But because the actual loss during this period was just under 3%, it doesn’t necessarily register as a big deal.
Historically, it’s actually a huge deal. Let’s just hold that thought for now.
Even though the net loss in the past two months hasn’t been significant, it’s also fair to point out that a pensive cloud currently hangs over NVDA stock. In the trailing month, the security has slipped more than 6%. Since the close of Halloween, NVDA is down roughly 14%. Thanks to market reflexivity — a phenomenon where perception, aided by feedback loops, alters reality — it’s possible (perhaps likely) that investors view Nvidia as being discounted.
Naturally, contrarian speculators have basic, common questions: when will NVDA stock bounce higher and how much will it rise?
Here, it may be instinctive to consider analysts’ opinions, where expert consensus pegs NVDA stock to hit around $253 over the next 12 months. While the average ratings provide a baseline expectation, it’s also important to note that stock prices are functions of state and not necessarily a function of consensus. Unfortunately, because the true causal state involves a gazillion variables, the answer may never be known.
In other words, the cause of reflexivity is a forever mystery but its influence can be calculated. It’s here that Barchart’s Expected Move calculator may be the most instructive baseline instrument available.
By integrating implied volatility (IV) into a proprietary parametric Black-Scholes-derived formulation, it’s possible to reverse engineer a stochastic price range for forward options chains. Basically, IV is a residual value derived from actual options demand. Therefore, it’s an objective benchmark to understanding the trading environment prior to placing your wager.
Narrowing Down a Path for NVDA Stock Through Distributional Analysis
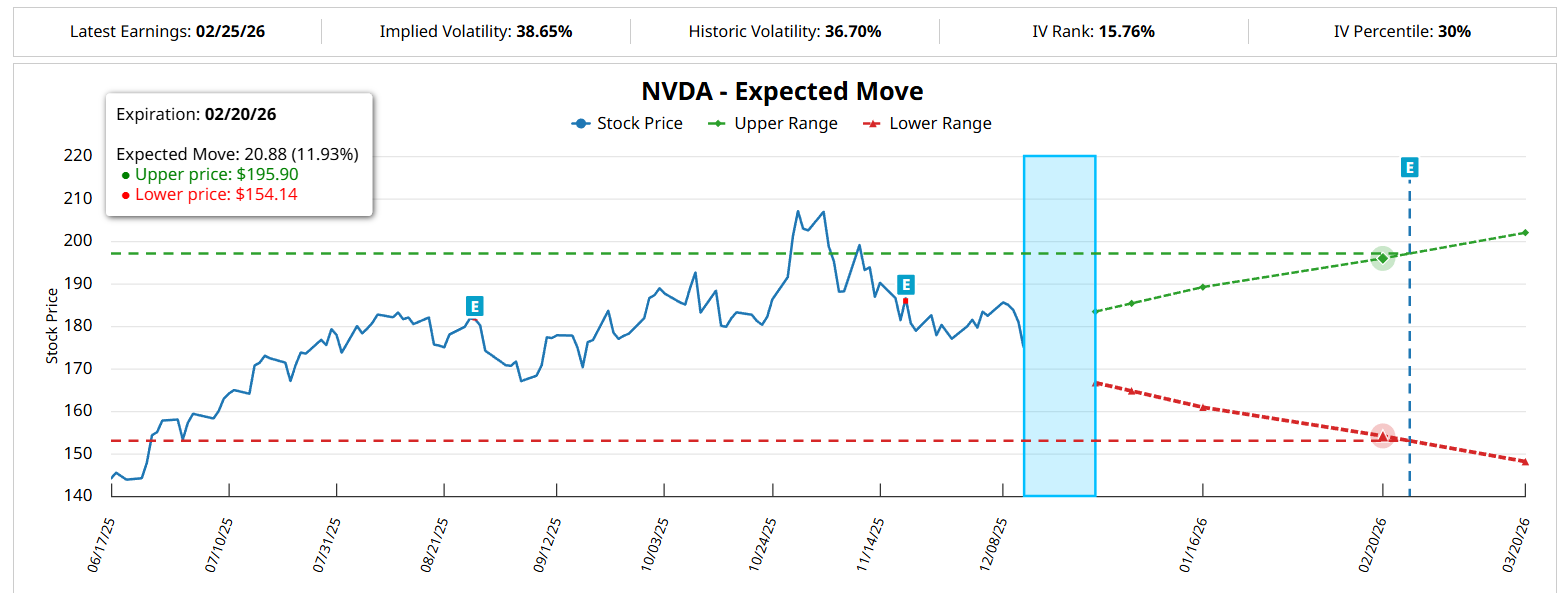
Looking at the options chain for Feb. 20, 2026, the Expected Move calculator forecasts a high-low price range from $195.90 down to $154.14. Most people would probably view the downside target as being unrealistically pessimistic. However, what’s really interesting is the upside target of nearly $196.
Due to the residual impact of options order flows, we have a good idea that call-based strategies that approach the $196 threshold will likely yield disproportionately greater rewards as the market believes reaching this zone is improbable. As a broad inference with some caveats, calls with strike prices rising toward this area are more likely to be sold than bought.
If we had a way of determining the true odds of where NVDA stock is likely to end up in the second half of February, we can make a better judgment call on whether to take the wager or not.
Earlier, I said that NVDA flashed a rare quant signal, which can be abbreviated as a 3-7-D sequence: three up weeks, seven down weeks, with an overall downward slope. If we discretize NVDA’s price history and look within our dataset for prior instances of the 3-7-D, we can then calculate where the target security is likely to end up.
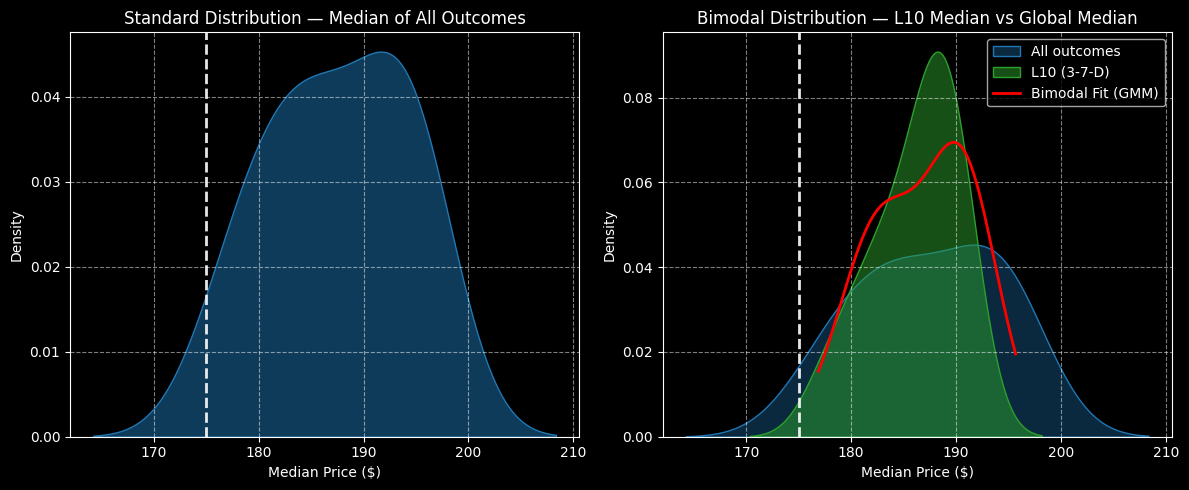
As it turns out, after NVDA stock flashes the aforementioned quant signal, the forward 10-week returns — when adjusted relative to Friday’s close of $175.02 — are likely to range between $170 and $198. Further, price density is thickest between $185 and $190. This is the area where NVDA would want to gravitate toward following the flashing of the 3-7-D sequence.
Interestingly, when aggregating all 10-week sequences — and not just the 3-7-D — NVDA stock would tend to coalesce around $190. Now, this doesn’t provide much of a structural arbitrage between the two distributions. Still, the distribution tied to the 3-7-D sequence features a much higher relative probability density than that associated with the aggregate.
Thanks to distributional analysis and the calculating of risk geometry, we understand that targeting the $190 strike price is a statistically reasonable wager. As such, it may be better to be buyers of Nvidia’s weakness — not sellers.
Probability Decay Matters Too
Armed with the market intel above and with all the tools associated with Barchart Premier, we can now easily calculate the most tempting vertical spread. Simply filter for the highest payout associated with multi-leg strategies featuring a $190 second-leg strike. That would be the 185/190 bull call spread expiring Feb. 20, 2026.
At time of writing, the maximum payout for triggering $190 at expiration would be 170.27%. Breakeven comes in at $186.85.
Still, bull spreads cap the potential reward so there’s always a risk of incurring an opportunity cost. However, by calculating risk geometry, we can better mitigate this annoyance.
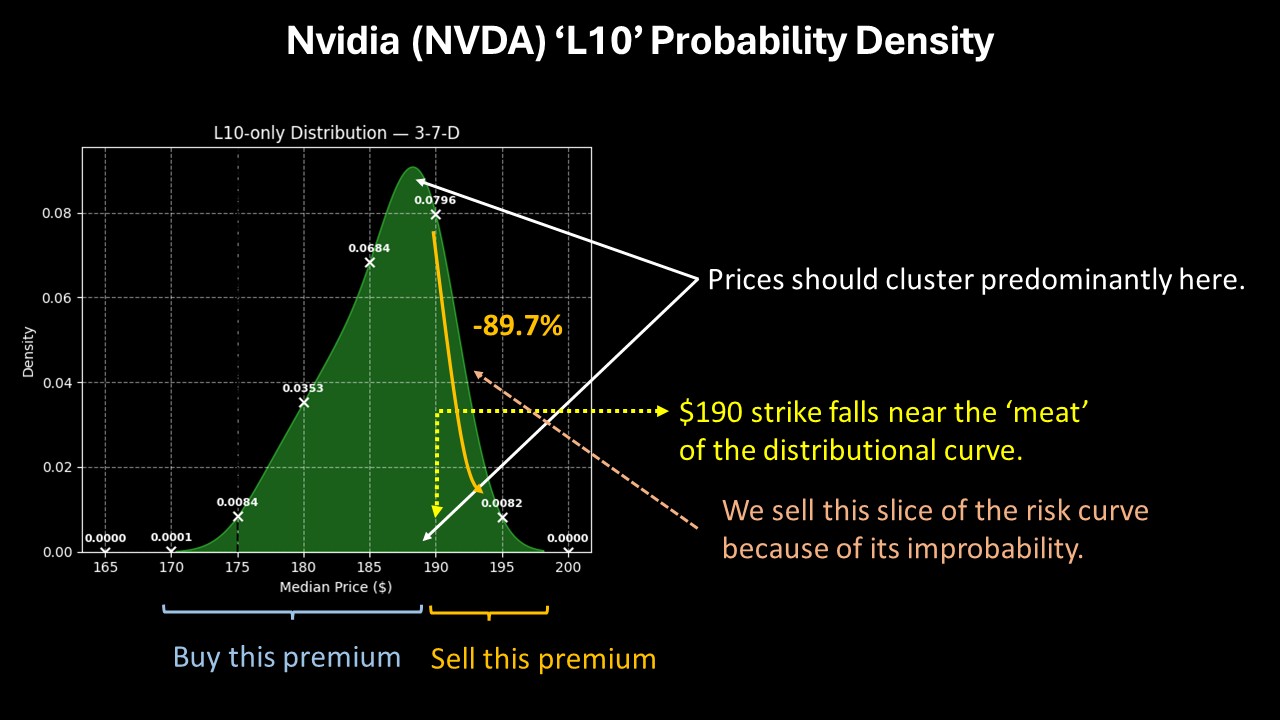
Thanks to our distributional analysis, we know that from $190 to $195, probability density drops by 89.7%. In other words, beyond $190, probability decay accelerates exponentially. Therefore, if the market is going to give us a triple-digit payout near the point of greatest probabilistic mass, it’s better to take that wager rather than be reckless and take the $195 bet.
Sure, the 190/195 bull spread expiring Feb. 20 offers a payout of over 233%. However, I don’t think that’s a great deal. For an additional 63.06% of payout percentage points, you would have to accept a probability decay (penalty) of nearly 90%.
That’s what I love about distributional analysis and the calculation of risk geometry. With this data, you buy the reality and sell the fantasy.
On the date of publication, Josh Enomoto did not have (either directly or indirectly) positions in any of the securities mentioned in this article. All information and data in this article is solely for informational purposes. For more information please view the Barchart Disclosure Policy here.
More news from Barchart
- The Saturday Spread: Here’s How to Properly Trade the Nvidia (NVDA) Stock Discount
- Visa’s Unusual Options Activity on Thursday Signals 3 Smart Profit Moves You Can Make Now
- Adobe Impresses the Market With Strong Free Cash Flow - Is ADBE Stock Worth Buying?
- This 1 Unusually Active IWM Put Option Screams Covered Strangle